Inequalities Methodology
Aims
The Energy Policy Tracker (EPT) Inequality and Poverty Dashboard (“the Dashboard”) provides information on the state of economic inequalities and poverty for the countries tracked in the EPT. It also tracks new information on the likely impacts of certain types of energy policies in terms of within-country income inequality (distributional impact) and monetary and multidimensional poverty.
By doing this, the research aims to address the following questions:
- How do countries perform in relation to key inequality and poverty indicators?
- What conceptual framework can guide policy-makers in assessing the ex-anteinequality and poverty effects of various categories of energy policies?
- What does the existing literature say about the effects of various types of energy policies on social outcomes, namely within-country inequalities and poverty?
- What contextual factors are most relevant when it comes to assessing the social effects of specific energy policy categories in each country’s context?
- How can policy-makers limit the socially regressive effects of certain energy policies, and which types of policies should be prioritized by governments when climate and social justice perspectives are jointly considered?
Scope
The Dashboard dataset includes 1,047 policies tracked on the EPT, adopted by 30 countries, as well as European institutions, between January 2020 and November 2021.
The literature used in the assessment is directly quoted in the report In Search of a Triple Win: Assessing the impacts of COVID-19 responses on the clean energy transition, inequality, and poverty.
The information displayed in the EPT Inequality and Poverty Dashboard is meant to be only indicativeof the state of play of inequality and poverty in a country. The categories’ assessment provided in the Dashboard is neither a systematic nor a granular assessment of each specific policy. In most cases, it represents a general assessment of the social risks associated with the various categories rather than of their actual social impacts.
Poverty and Inequality Indicators
The poverty and inequality indicators presented in the Dashboard heat maps are a collection of data on the state of play of within-country inequality and poverty.
These indicators, presented for the 30 countries and European institutions covered by the EPT, are separate and different from those presented in the summary assessment tables.
These indicators are:
- The Gini coefficient for the years 2008 and 2020, as defined by the World Bank.
- The percentage change in the Gini coefficient between the years 2008 and 2020.
- The poverty gap at USD 3.20 a day at purchasing power parity (PPP), as defined by the World Bank.
- Low absolute energy expenditure, as defined by the EU Energy Poverty Observatory. Note: only countries within the European Union are covered by this poverty indicator.
- The electricity access rate as defined by the World Bank.
- Per capita emissions of the top 10% of income earners, as defined in the World Inequality Database.
- Per capita emissions of the bottom 50% of income earners, as defined in the World Inequality Database.
- With the last two inequality indicators, we calculated the ratio of per capita emissions of the top 10% to the bottom 50% of the population.
Assessment Process
The EPT Inequality and Poverty Dashboard is based on policy categories that have been developed in the following steps:
- The policy categories are defined based on the policies recorded in the EPT. These policy categories (i) reflect the most prevalent policies and (ii) focus on the policies that have the highest potential impact in terms of inequality and poverty. They group similar policies together for each of the sectors covered in the EPT (buildings, mobility, power, and resource extraction) based on their incidence (support to consumption, production, or infrastructure), their classification on the EPT (clean, fossil fuel, or other energy), and the specific type of energy they support. They also provide a taxonomy for a wide range of support measures directed at the energy-related sectors included in the EPT analysis.
Table 1. Examples of policy categories
| Policy category | EPT sector | Incidence | EPT classification |
| Government support for public transport (cheaper fares for users) | Mobility | Consumer | Clean |
| Increases in electricity tariffs for households and related regulatory changes | Power | Consumer | Other energy |
| Government support to the buildings sector without climate strings attached | Buildings | Consumer | Fossil |
| Government support for resource storage, transportation, or infrastructure | Resource extraction | Supply | Fossil |
- We associated the 1,047 policies in our dataset with one or more relevant policy categories.
- The poverty and inequality impacts of each policy category are assessed based on (i) information from the literature and (ii) a conceptual framework.
Figure 1. Key steps of the conceptual framework
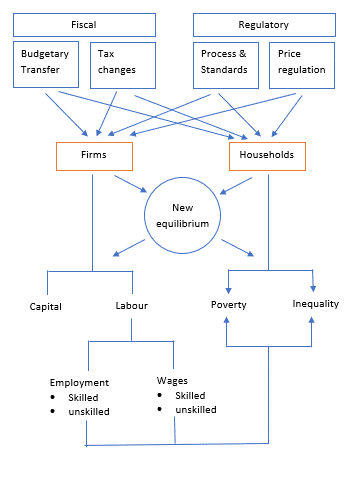
Figure 1 outlines the key steps of the conceptual framework used to understand how different kinds of energy categories are likely to influence poverty and inequality dimensions. It shows the various channels through which such impacts might occur.
The conceptual framework differentiates four generic types of fiscal and regulatory policy: budgetary transfers, tax changes, process and standards, and price regulations. Impacts on inequality and poverty are then considered through the lens of how each type of policy may affect households and firms, both directly and indirectly, through changes to employment and wages and changes in consumption and commodity prices. The framework also questions the spatial impacts of policies, as well as their effects over time.
- These expected effects on inequality and poverty have then been ranked:
a) The assessment of the policy categories against the inequality dimension assesses whether the implementation of a certain policy category risks increasing or decreasing inequality between different income groups or having neutral or unclear effects (Table 2).
Table 2. Classification of inequality effects
| Likely decreasing effects | Risk of increasing effects | Neutral effects | Unclear effects | |
| Inequality Dimension | The expected effect of the considered policy category is that the income gap between low-income and high-income groups is likely to decrease. | The expected effect of the considered policy category is that the income gap between low-income and high-income groups is likely to increase. | The expected effect of the considered policy category is that the income gap between low-income and high-income groups is likely not to be affected. | The expected effect of the considered policy category on inequality is unclear, as existing evidence is inconclusive or missing. |
- b) The assessment of the policy categories against the poverty dimension assesses whether the implementation of a certain policy category will likely increase, decrease, or have a neutral or unclear effect on poverty (Table 3).
Table 3. Classification of poverty effects
| Likely decreasing effects | Risk of increasing effects | Neutral effects | Unclear effects | |
| Poverty Dimension | The expected effect of the considered policy category is that monetary or multidimensional poverty is likely to decrease. | The expected effect of the considered policy category is that monetary or multidimensional poverty is likely to increase. | The expected effect of the considered policy category is that monetary or multidimensional poverty is likely not to be affected. | The expected effect of the considered policy category on monetary or multidimensional poverty is unclear as existing evidence is inconclusive or missing. |
We also provide a level of confidence (low/medium/high) for the inequality dimension and poverty dimension findings, which gives an indication of the availability of the literature and consistency of findings. For instance, a finding associated with high confidence means that we were able to identify a wide range of relevant literature with robust and mostly aligned conclusions.
- For the two dimensions of inequality and poverty, a description of the effects of each policy category is provided, along with:
a) Contextual factors that can be used to better assess the direction and the magnitude of the effects.
b) Policy design elements and complementary policies that can be implemented to mitigate the direction and magnitude of the effects.
In-Depth Analysis of the Policy Categories
In addition to the presented summary tables, the in-depth and full analysis of the policy categories classified by EPT sectors (buildings, mobility, power, and resource extraction) is available on demand. For queries, please contact [email protected].
Verification of the Methodology
The methodology has been developed jointly by the International Institute for Sustainable Development (IISD) and ODI. The conceptual framework was developed by Neil McCulloch (The Policy Practice).
The methodology has been reviewed by the following people:
Enrico Botta (Organisation for Economic Co-operation and Development), Miquel Muñoz Cabré (Stockholm Environmental Institute), Tara Laan (IISD), Florian Mersmann (HUMBOLDT-VIADRINA Governance Platform), Tom Moerenhout (Columbia University), Yannick Oswald (University of Leeds – School of Earth and Environment), Lukas Welker (IISD), Chloe McElhone (University of Toronto)
 Argentina
 Australia
 Bangladesh
 Brazil
 Canada
 Chile
Chile China
China Colombia
 Egypt
Egypt Estonia
 European Institutions
 Finland
 France
 Germany
 India
India Indonesia
 Italy
Italy Japan
Japan Kenya
Kenya Mexico
 New Zealand
 Nigeria
 Norway
 Peru
Peru Philippines
 Poland
 Republic of Korea
 Russia
 Saudi Arabia
 South Africa
 Spain
Spain Sweden
 The Netherlands
 Turkey
 Ukraine
 United Kingdom
 United States
 Vietnam